Simple prediction (squared last 2w) based on Worldometers [Live]
Impact
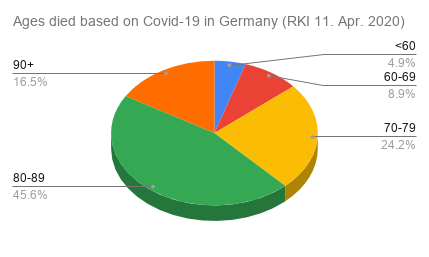
Based on Robert Koch Institute (RKI) 2540 persons died based on Covid-19 till 11. Apr. 2020 in Germany. Distribution of ages you see in the graphic below.
The average age was 82years – the average life expectation is Germany according United Nations data is 81.4years (macrotrends.net) – Impact?
Lock down on all groups – any impact for kids if are missing the social experimenting and experience in school? Any impact if Google and Apple is implementing tracing functionality? Any impact based on increasing stress on families? Any impact if someone will not be able to meet their beloved? Any impact if some are running just out of time in their life without some helping hand?
#!/usr/bin/python3
import numpy as np
import pandas as pd
import matplotlib.pyplot as plt
from datetime import datetime, date
# some variables
now = datetime.now() # date/time of software execution
endDate = date(year = now.year, month = now.month, day = now.day) # date of software execution (end of analytics period)
startDate = date(year = now.year-10, month = now.month, day = now.day) # 1 year earlies (begin of analytics period)
deltaYears = (endDate-startDate).days/365.2425 # difference of startDate and endDate in years
# read csv file & build timeseries
# raw = pd.read_csv("./Reference/stocks_2/JP3942600002.EUR.csv", header=None)
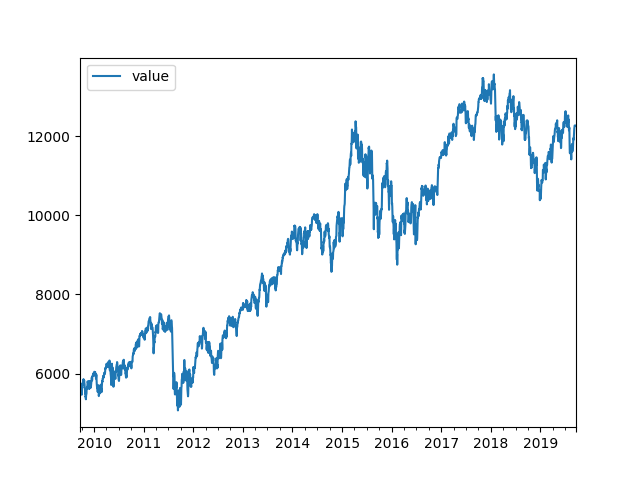
raw = pd.read_csv("./DAX.EUR.csv", header=None)
ts = pd.DataFrame(columns=['datetime','value']) # generate timeframe
ts['datetime'] = pd.to_datetime(raw[0]) # load column-datetime with the raw-timestamps
ts['value'] = raw[1] # load column-value with the values
ts = ts.set_index('datetime') # index based on datetime
# print(ts)
# reduction of timeseries to the choosen period and cleaning for weekdays
ts = ts.resample('D').ffill() # generate sample size one-day and fill missing elements
selection = pd.date_range(startDate, endDate, freq='B') # generat selection from startDate to endDate with weekdays
ts = ts.asof(selection) # get subset of ts according selection and interpolate remaining ()
# print(ts)
# some calculation
val = np.array(ts['value'])
res = np.log(val[1:]/val[:(len(val)-1)])
# r = (np.power(1+np.mean(res),len(res))-1)*100 # performance
r = (np.power(np.power(1+np.mean(res),len(res)),1/deltaYears)-1)*100 # performance (annual)
v = np.std(res)*np.sqrt(len(res))*100/np.sqrt(deltaYears) # vola (annual)
print('Annual Performance: ',r)
print('Annual Vola: ',v)
# check
ts.head()
# plot
ts.plot()
plt.show()
Facebook, Linkin, Google, Newspapers, … So many infos & data for free but overloaded with spam or ads. What about providing a filtered view, where the user 100% can control the filter with a learned tailored algorithm? AI? ML?